


When people search for “OpenICU software for critical care dashboard,” it is easy to assume they are looking for a ready-made ICU dashboard application that clinicians can open in a browser and use for bedside monitoring.
That is not what the current OpenICU project is.
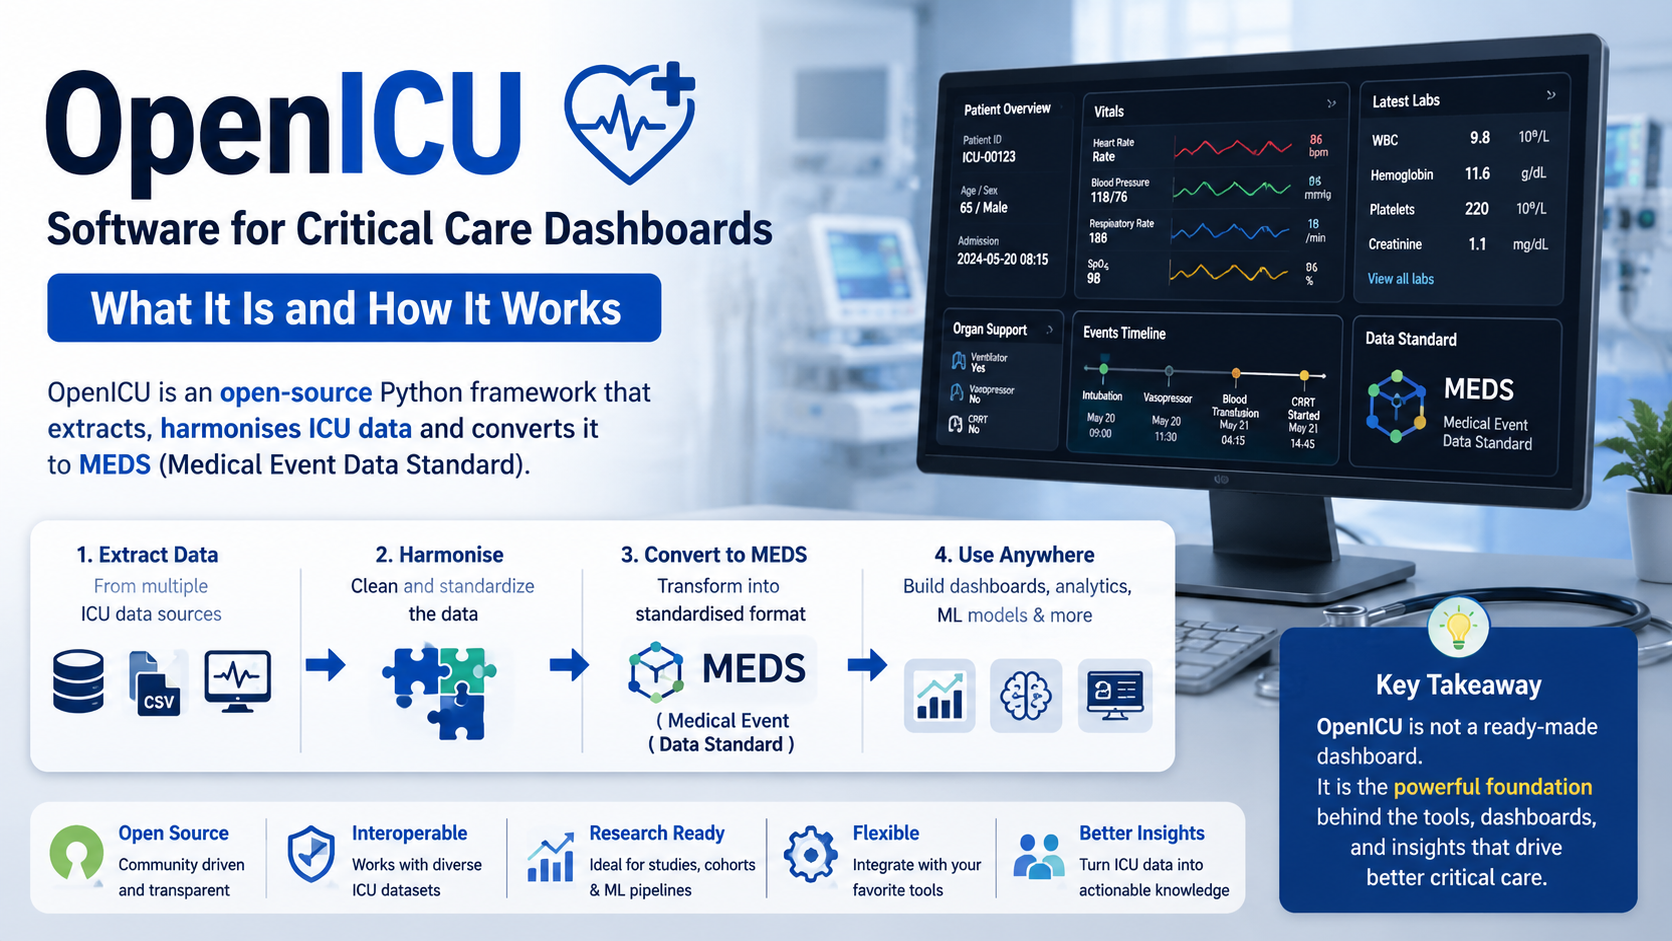
OpenICU is an open-source Python framework for extracting and harmonising intensive care unit data from different datasets and converting it into the Medical Event Data Standard (MEDS). It is primarily a data-engineering and research tool, not a finished bedside monitoring dashboard or electronic health record replacement.
That distinction matters. OpenICU can be an important foundation for building critical-care analytics, research dashboards, machine-learning pipelines, cohort analysis tools, and other visual interfaces, but the dashboard itself normally has to be created with another application or visualization layer.
What Is OpenICU?
OpenICU is designed to solve a common problem in intensive-care research: ICU data comes from many different systems, and the same clinical concept can be represented differently from one dataset to another.
For example, heart rate, blood pressure, laboratory measurements, vasopressor administration, and ventilation parameters may exist under different table structures, identifiers, units, and timestamp conventions depending on the source. OpenICU provides a standardized way to extract that information and map it to common clinical concepts.
The project currently describes itself as an open-source Python framework that can work with sources including MIMIC-IV, eICU-CRD, AmsterdamUMCdb through OMOP CDM, and institutional or OMOP CDM exports. It produces data in MEDS format so downstream analysis tools can work with a consistent representation.
In simple terms:
OpenICU prepares messy ICU data so other software can understand it consistently.
A dashboard is then one possible destination for that standardized data.
OpenICU Is Not a Ready-Made ICU Dashboard
This is the most important point for anyone searching for an OpenICU critical care dashboard.
OpenICU’s official repository describes a pipeline made up of extraction and concept-harmonisation steps. Its documented output is a MEDS dataset, stored using formats such as Parquet, rather than a graphical patient-monitoring application.
The architecture is essentially:
Raw ICU data → OpenICU extraction → harmonized clinical concepts → MEDS dataset → analysis or dashboard
That means OpenICU sits closer to the data layer than the user-interface layer.
A hospital dashboard designed for clinicians might display:
- Current heart rate and blood pressure
- Oxygen saturation
- Ventilator settings
- Laboratory trends
- Medication and infusion status
- Fluid balance
- Clinical scores
- Patient deterioration indicators
- Unit-wide bed status
A framework such as OpenICU does not automatically turn those values into such a polished screen. Instead, it helps make the underlying data structured enough that another application can display it.
Why a Standardized ICU Data Layer Matters
Critical-care data is unusually complex because ICU patients generate information continuously from many sources.
A single patient record can contain vital signs, laboratory results, medication administrations, ventilation information, neurological assessments, fluid output, diagnoses, procedures, and other time-based events.
The same concept can also appear in different formats depending on the database.
Suppose a research team wants to study heart rate across several ICU datasets. Without harmonisation, researchers may need to write separate extraction logic for every database.
One dataset might store a particular measurement under one identifier while another uses a different identifier or table structure.
OpenICU addresses this by separating two ideas:
Dataset-specific representation: how the original database stores the measurement.
Clinical concept: what the measurement actually means.
The framework’s configuration system allows the concept to be defined once and then mapped to dataset-specific representations. Its documentation gives examples such as heart rate, norepinephrine rate, and antibiotics.
This is particularly useful when a dashboard must present information from more than one ICU data source.
How OpenICU Works
OpenICU uses a pipeline approach rather than requiring researchers to manually transform every source dataset.
The project’s documented workflow is broadly:
Raw source files → extraction → MEDS events → concept harmonisation → downstream analysis.
1. OpenICU Reads the Source Data
The source may contain files such as CSV, compressed CSV, or Parquet. OpenICU’s current documentation specifically describes working directly with downloaded files rather than requiring a database server for the supported sources.
For example, an ICU dataset can contain a table with:
- Patient or encounter identifier
- Measurement timestamp
- Item identifier
- Numeric value
- Unit
- Other metadata
The framework’s extraction configuration defines how that table should be interpreted.
2. Extraction Converts Tables Into Events
An event is simply something that happened or was observed at a particular time.
For instance:
10:00 — Heart rate — 94 bpm
10:05 — Heart rate — 97 bpm
10:10 — Heart rate — 101 bpm
The project’s example configuration maps source columns such as subject_id, charttime, itemid, and valuenum into a standardized event representation.
3. Concept Harmonisation Gives the Data a Common Meaning
Extraction alone does not necessarily make two databases comparable.
The next stage maps dataset-specific events to broader clinical concepts. OpenICU’s configuration includes concepts such as heart rate, with dataset-specific mappings determining which source codes represent that concept.
This is the part that becomes especially valuable for cross-dataset research.
4. The Results Are Stored in MEDS
OpenICU targets the Medical Event Data Standard, or MEDS.
MEDS is an open data schema for representing streams of medical events. Its core structure is deliberately small: a subject, a time, and a code, with optional numeric and text values.
For a critical-care dashboard, this means the dashboard does not have to understand every original ICU database structure.
Instead, it can work with a more consistent event stream.
What Is MEDS and Why Does It Matter for ICU Dashboards?
MEDS is important to understand because it is the format OpenICU is built around.
The central idea is simple:
An observation can be represented as who it belongs to, when it happened, what it represents, and what value it contains.
The MEDS schema requires three core fields:
| Field | Simple meaning |
|---|---|
subject_id | Which patient or subject the event belongs to |
time | When the event occurred |
code | What the event represents |
numeric_value | Optional numerical measurement |
text_value | Optional textual value |
The current MEDS schema also places important requirements on how data is organized, including keeping a subject’s data together within a shard and maintaining chronological ordering.
For dashboard development, that kind of consistency can simplify queries and downstream processing.
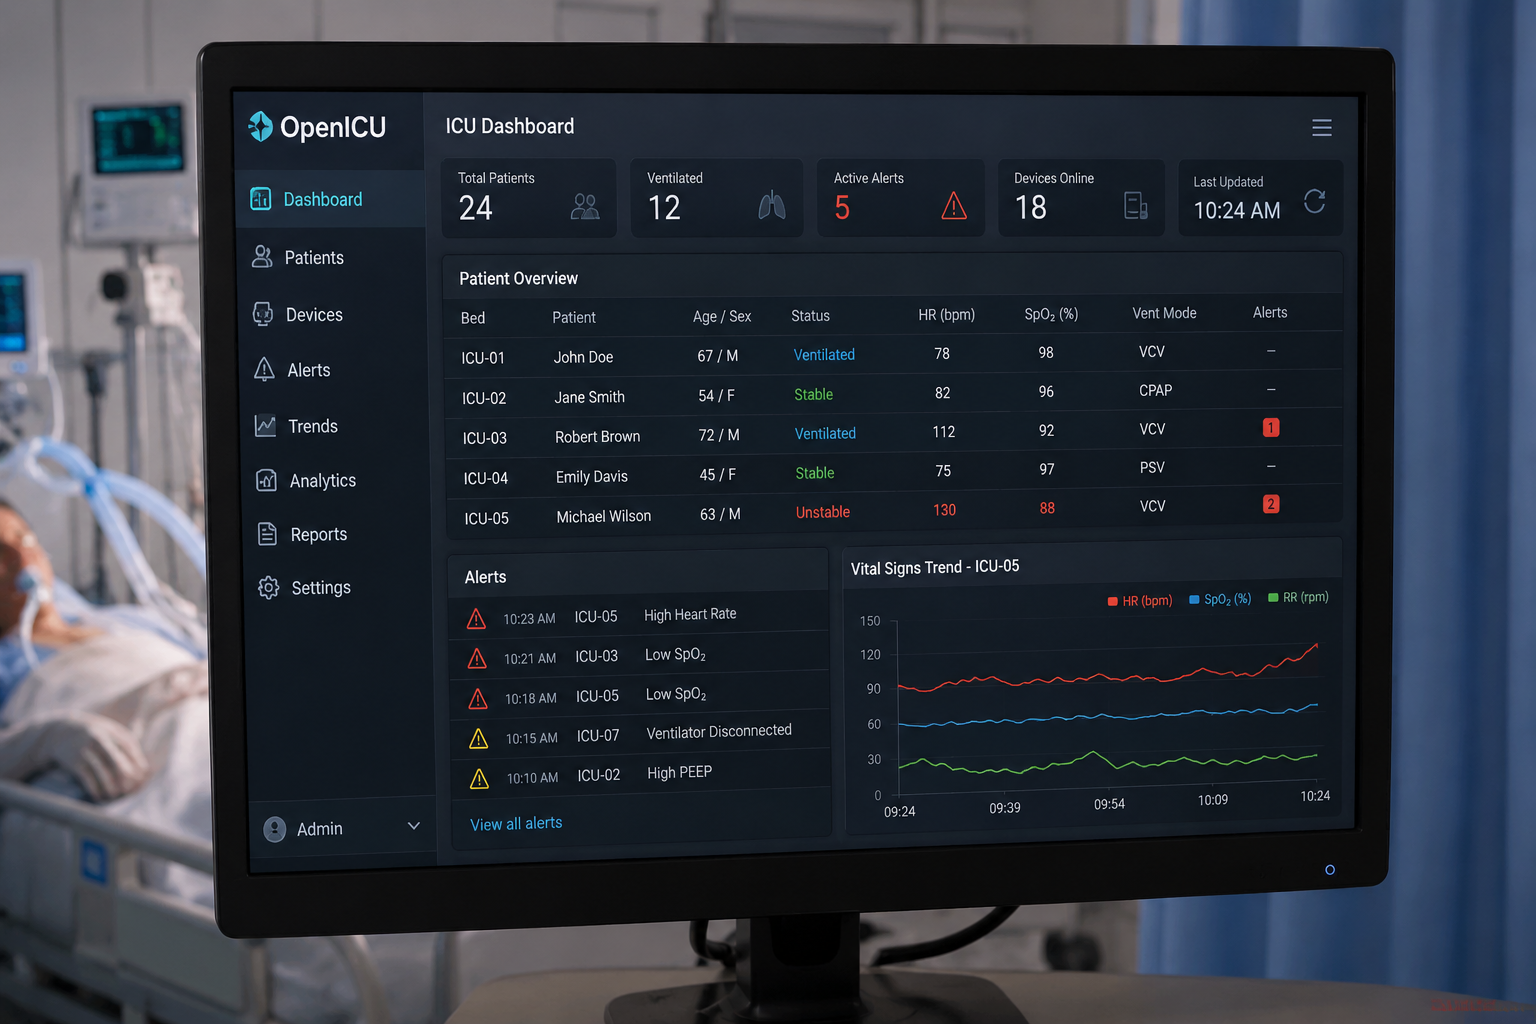
What Could an OpenICU-Based Critical Care Dashboard Show?
OpenICU itself does not prescribe a particular dashboard design, but its supported concepts indicate the kinds of information that can be made available for analysis or visualization.
The current project documentation describes a shared concept dictionary covering areas such as:
Vital signs, blood gases, clinical chemistry, hematology, medications, including vasopressors and antibiotics, neurological scores, respiratory parameters, fluid output, and demographics.
That provides a useful foundation for building several kinds of dashboard.
Patient-Level Dashboard
A patient dashboard could place the most important information in one view:
| Dashboard area | Example information |
|---|---|
| Vital signs | Heart rate, blood pressure, temperature, SpO₂ |
| Respiratory status | Ventilation parameters and oxygen-related measurements |
| Laboratory trends | Blood gas and chemistry results |
| Medications | Antibiotics, vasopressors and other medications |
| Neurological status | Relevant neurological or sedation scores |
| Fluid management | Input/output and fluid-related observations |
| Timeline | Events plotted against time |
This would be a custom application built on top of OpenICU output, rather than an OpenICU feature itself.
Unit-Level Dashboard
A larger ICU command screen could aggregate information across patients.
For example, each patient could become one row containing selected measurements and derived indicators:
| Patient | HR | SpO₂ | MAP | FiO₂ | Vasopressor | Recent Lab Change |
|---|---|---|---|---|---|---|
| ICU-01 | 94 | 97% | 76 | 40% | No | Stable |
| ICU-02 | 112 | 91% | 63 | 60% | Yes | Worsening |
| ICU-03 | 81 | 98% | 84 | 30% | No | Stable |
Again, this table is an example of what a downstream dashboard could present, not a screen provided by OpenICU.
The Technology Stack Behind OpenICU
OpenICU’s current architecture is built around several modern Python components.
The project uses Polars for data processing, Pydantic for validated configuration, YAML for declarative configuration, and MEDS for the standardized output model.
Polars
Polars is a DataFrame and query-processing library designed for efficient data manipulation.
OpenICU uses Polars with lazy and streaming processing. The project states that this is intended to allow processing of large ICU datasets without necessarily requiring a database cluster.
Pydantic
Pydantic is used for structured validation.
In practical terms, this helps OpenICU ensure that configuration information conforms to expected data structures before or during processing.
YAML
Much of OpenICU’s behavior is described declaratively using YAML configuration files.
This is significant because adding support for a dataset can involve configuration rather than rewriting the entire framework in Python. The project explicitly says new datasets can be added by writing YAML, while Python callbacks remain available for more complicated transformation logic.
Parquet
OpenICU’s documented MEDS output uses Parquet, a columnar data format commonly used for analytical workloads. The project describes its output as MEDS-compliant Parquet with metadata files such as dataset.json and codes.parquet.
Which ICU Datasets Does OpenICU Support?
The supported dataset landscape is an important part of OpenICU’s value.
The current project repository lists configurations for:
| Dataset | Current project status |
|---|---|
| MIMIC-IV | Supported configurations |
| MIMIC-IV demo | Supported via inherited configuration |
| eICU-CRD | Supported configuration; concept mappings still developing |
| eICU-CRD demo | Supported via inherited configuration |
| NWICU | Configuration available; mappings developing |
| OMOP CDM 5.4 | Reusable model configuration |
| AmsterdamUMCdb | Uses OMOP/AMSTEL configuration |
| HiRID | Native-format configuration |
| SICdb | Native-format configuration |
OpenICU also states that concept coverage and dataset mappings remain under development for several sources.
That qualification is important: supporting a dataset configuration does not necessarily mean that every clinical variable in that dataset is already harmonized.
OpenICU and MIMIC-IV
MIMIC-IV is one of the most relevant datasets for ICU research, and OpenICU provides extraction configurations for MIMIC-IV versions 3.1 and 2.2, according to the current repository documentation.
A research dashboard built around MIMIC-IV could therefore use OpenICU to transform selected ICU tables into standardized events and concepts before sending those results to the visualization layer.
However, MIMIC is primarily a research dataset, not a source for real-time bedside monitoring.
That distinction should never be ignored.
A dashboard using historical MIMIC-IV data can be useful for:
- Retrospective analysis
- Education
- Research
- Cohort exploration
- Model development
- Visualization experiments
It should not be described as a live ICU monitoring system simply because it displays ICU measurements.
OpenICU and Real-Time Critical Care Monitoring Are Different Problems
A major source of confusion is treating ICU analytics and live bedside monitoring as the same technology.
They are not.
A real-time critical-care monitoring system usually needs continuous integration with bedside devices, clinical systems, alarms, network infrastructure, authentication, monitoring of data freshness, clinical workflows, and strong safety controls.
OpenICU’s documented purpose is instead data extraction and harmonisation from datasets and exported data sources.
Therefore:
OpenICU is well suited to preparing ICU data for analytics.
OpenICU is not documented as a certified bedside monitoring or alarm platform.
OpenICU should not be treated as a substitute for an ICU patient-monitoring system or hospital EHR.
This difference becomes especially important when discussing clinical decision-making.
A Practical OpenICU Dashboard Architecture
A useful architecture for a research or internal analytics dashboard might look like this:
ICU Data Sources
      │
      ├── MIMIC-IV
      ├── eICU-CRD
      ├── OMOP exports
      └── Institutional data
              │
              ▼
          OpenICU
              │
       ┌──────┴──────┐
       │             │
   Extraction    Harmonisation
       │             │
       └──────┬──────┘
              ▼
          MEDS / Parquet
              │
              ▼
     Analysis / Query Layer
              │
              ▼
       Dashboard Application
              │
       ┌──────┼──────┐
       │      │      │
    Charts  Tables  Trends
The important architectural idea is that OpenICU sits between raw clinical data and the application that consumes that data.
This separation can make systems easier to maintain because the visualization application does not need to know the internal quirks of every original ICU database.
Why This Approach Can Be Better Than Writing One-off Scripts
Without a harmonisation layer, researchers often create custom scripts for every dataset.
That can lead to duplicated logic:
MIMIC extraction script
eICU extraction script
HiRID extraction script
Institutional extraction script
Each script may implement similar ideas differently.
OpenICU instead encourages a shared conceptual layer:
Heart rate
Blood pressure
Vasopressor rate
Oxygenation
Ventilation
Then each dataset supplies the mapping required to locate those concepts.
The project itself describes this as the idea of “one concept, many datasets.”
This can improve reproducibility, because the extraction and mapping definitions are stored as versioned configuration rather than hidden inside ad-hoc analysis code.
Reproducibility Is One of OpenICU’s Strongest Features
Clinical data analysis becomes difficult to reproduce when researchers cannot determine exactly how the raw data was transformed.
OpenICU addresses this with versioned configurations and project snapshots. Its documentation states that the merged configuration used in a run is saved with the resulting project, helping trace how the data was produced.
This matters when a dashboard is being used for research.
Imagine a graph showing:
“Patients with increasing vasopressor requirements.”
A reviewer should be able to understand:
- Which source dataset was used
- Which version of that dataset was processed
- Which clinical codes were included
- What unit conversions occurred
- What transformation rules were applied
- Which concept definition produced the final variable
A standardized and reproducible pipeline makes that much easier than a collection of undocumented scripts.
Can OpenICU Be Used With Sensitive ICU Data?
OpenICU’s project documentation explicitly describes an offline workflow, stating that it is designed for sensitive medical data and does not require network access during its processing workflow.
That can be useful in environments where patient information must remain inside an organization’s controlled infrastructure.
However, offline processing does not automatically make a system compliant with every healthcare privacy or security requirement.
A hospital deployment still needs its own controls covering access, authentication, authorization, logging, encryption, data retention, network architecture, backups, and applicable legal or regulatory obligations.
OpenICU should therefore be viewed as one component of a secure architecture, not as a complete healthcare security program.
Current OpenICU Status
OpenICU is still described by its maintainers as being in active development and pre-1.0. The project warns that configuration formats may change between minor versions.
Its stated roadmap includes completing more concept mappings, expanding dataset support, improving analysis-ready sharding, and broadening OMOP CDM coverage.
The repository currently requires Python 3.13 or newer, according to its published installation information, and can be installed from PyPI or directly from GitHub. It is released under the MIT License and is developed by the AIDH MS team at the University of Münster and the Medical University of Innsbruck.
Because the project is pre-1.0, organizations should avoid assuming that its APIs, configurations, or mappings are as stable as those of a mature enterprise clinical platform.
OpenICU’s Relationship With AI and Clinical Research
Standardized ICU data is particularly valuable for machine-learning research.
Health-AI researchers often need to combine large numbers of time-stamped observations, such as vital signs, medications, laboratory results, and clinical events. MEDS was designed as an open standard for medical event streams and is intended to improve interoperability and reproducibility in health-AI research.
OpenICU provides an ICU-focused mechanism for getting heterogeneous critical-care data into that ecosystem.
This can make an OpenICU-based workflow useful for:
Predictive modeling, where models need longitudinal ICU observations.
Clinical research, where researchers compare cohorts across datasets.
Benchmarking, where consistent input representation is important.
Dashboard analytics, where normalized measurements can be queried and visualized more consistently.
But there is an important boundary: standardizing the data does not make an AI model clinically validated. A model trained on standardized research data still requires appropriate validation, bias assessment, monitoring, and clinical governance before it could be considered for real clinical use.
Advantages of Using OpenICU as a Dashboard Data Foundation
| Advantage | Why it matters |
|---|---|
| Open source | Organizations can inspect and modify the implementation |
| Python-based | Fits common research and data-science workflows |
| Multiple ICU datasets | Makes cross-dataset analysis more practical |
| Concept harmonisation | Reduces repeated dataset-specific logic |
| MEDS output | Gives downstream tools a consistent event representation |
| Declarative configuration | Much of the mapping is defined in YAML |
| Offline workflow | Useful for controlled environments with sensitive data |
| Versioned processing | Helps improve reproducibility |
These advantages are particularly relevant for research dashboards and analytical platforms rather than bedside device monitoring.
Limitations You Should Know Before Building a Dashboard
OpenICU also has important limitations.
It Does Not Provide the Complete Dashboard
Developers still need to build the visualization, filtering, authentication, user management, alerting interface, database/query service, and deployment infrastructure.
Dataset Coverage Is Not Complete
The project currently identifies a number of concept mappings as still being developed. A specific variable you need may therefore require additional mapping work.
Pre-1.0 Software Needs Version Discipline
Configuration formats can change during active development. Projects should pin versions and keep reproducible configuration snapshots.
Clinical Data Quality Remains a Problem
Standardization does not repair incorrect source data.
If a source dataset contains missing, duplicated, delayed, incorrectly unitized, or otherwise problematic measurements, OpenICU cannot magically determine the true clinical value.
It Is Not a Clinical Monitoring Device
OpenICU should not be positioned as an ICU monitor, alarm-management system, or replacement for clinical information infrastructure. Its documented function is data extraction and harmonization.
OpenICU vs a Traditional ICU Dashboard
| Capability | OpenICU | Typical ICU Dashboard |
|---|---|---|
| Extract heterogeneous datasets | Yes | Depends on system |
| Harmonize clinical concepts | Yes | Usually limited or backend-specific |
| Standardized MEDS output | Yes | Not necessarily |
| Patient visualization | Not its primary purpose | Yes |
| Real-time bedside monitoring | Not documented as its purpose | Often yes |
| Device alarm management | No | Often included in monitoring platforms |
| Research data preparation | Strong use case | Varies |
| Cross-dataset research | Strong use case | Usually not the primary goal |
| EHR replacement | No | No, unless part of a larger HIS/EHR |
| Ready-to-deploy clinical UI | No | Usually |
The key difference is simple:
OpenICU standardizes the data; a dashboard presents the data.
How Developers Could Turn OpenICU Data Into a Dashboard
A development team could use the standardized output as the backend data source for a web application.
For example:
OpenICU
   ↓
MEDS Parquet files
   ↓
Python / SQL / analytics layer
   ↓
Dashboard API
   ↓
Web interface
The dashboard might then provide filtering such as:
ICU unit → patient → time range → clinical concept → trend
A patient page could show a 24-hour timeline for heart rate, blood pressure, SpO₂, medications, respiratory parameters, and laboratory values, while an overview page could summarize several ICU patients at once.
The exact technologies used for the final interface are not dictated by OpenICU. A team could select its own web framework, database technology, charting library, or business-intelligence platform depending on its requirements.
Should Hospitals Use OpenICU for a Production Critical-Care Dashboard?
That question requires more caution than a simple yes or no.
For research, retrospective analysis, educational applications, and internal analytics, OpenICU can be a useful foundation because its purpose aligns closely with standardized ICU data processing.
For a production clinical dashboard that influences care, the problem becomes much larger.
The deployment must address data freshness, missing values, device integration, clinical workflow, access control, audit requirements, resilience, validation, human factors, and the consequences of incorrect information.
In that environment, OpenICU may be one component of the technical pipeline, but it should not be confused with a complete clinical product.
A useful rule is:
Use OpenICU to solve the data-standardization problem, not to pretend the clinical-interface problem has already been solved.
A Good Use Case: Research Dashboard Across Multiple ICU Datasets
Consider a research group investigating treatment patterns in critically ill patients.
The team has:
MIMIC-IV data from one source, eICU-CRD data from another, and another ICU dataset using a different schema.
Without a harmonization layer, the team could spend substantial effort writing and maintaining separate extraction logic.
With OpenICU, the workflow can instead define common clinical concepts and map each dataset to those concepts. The resulting MEDS data can then feed a single analytical workflow or visualization layer.
A dashboard built on top could allow researchers to select:
Dataset → patient cohort → clinical variable → time range
and then compare trends in a standardized way.
That is a much more natural application of OpenICU than trying to turn it directly into a bedside monitor.
What “Critical Care Dashboard” Should Mean in This Context
A useful OpenICU-related dashboard can be thought of as an analytical dashboard for critical-care data, not necessarily a live physiological monitor.
That distinction helps avoid several common misunderstandings.
If the goal is:
“Show me historical ICU trends across research datasets.”
OpenICU can be highly relevant.
If the goal is:
“Give an intensivist a live view of every ventilator and bedside monitor.”
OpenICU alone is not the appropriate description of the required technology.
If the goal is:
“Standardize ICU data before feeding it to an analytics or visualization application.”
That is much closer to OpenICU’s documented purpose.
Frequently Asked Questions
Is OpenICU a critical-care dashboard software?
Not by itself. OpenICU is an open-source Python framework for ICU data extraction and harmonization. It produces standardized data that can be used by downstream analysis and dashboard applications.
Can OpenICU be used to build an ICU dashboard?
Yes, as a data-processing foundation. A separate visualization or web application can consume OpenICU’s standardized output and display ICU trends, tables, and analytics.
Does OpenICU provide a graphical patient-monitoring interface?
The current official project documentation describes extraction pipelines, configuration, standardized datasets, and analysis outputs rather than a ready-made bedside monitoring interface.
What data can OpenICU harmonize?
Its current concept dictionary includes areas such as vital signs, blood gases, clinical chemistry, hematology, medications, vasopressors, antibiotics, neurological scores, respiratory parameters, fluid output, and demographics.
Does OpenICU support MIMIC-IV?
Yes. The current repository lists configurations for MIMIC-IV 3.1 and 2.2.
Does OpenICU support eICU-CRD?
Yes, OpenICU has eICU-CRD extraction configurations, although the project notes that concept mappings are still being developed.
What is MEDS?
MEDS stands for Medical Event Data Standard. It is an open schema for representing streams of medical events using a compact subject/time/code model with optional numeric and text values.
Can OpenICU process data offline?
Yes. Its documentation describes it as designed for offline processing and says that the workflow does not require network access to send data elsewhere.
Is OpenICU ready for every hospital’s production ICU environment?
That should not be assumed. The project is currently pre-1.0 and actively developing, and its documentation notes that configuration formats can change. A production clinical deployment would also require significant application, security, integration, validation, and clinical-governance work beyond the data-harmonization layer.
Final Verdict
The phrase “OpenICU software for critical care dashboard” describes a useful idea, but the terminology needs to be precise.
OpenICU is not itself a finished critical-care dashboard. It is an open-source ICU data extraction and harmonization framework that converts heterogeneous critical-care data into the standardized MEDS format.
Its real value is underneath the dashboard: extract the right data, reconstruct events correctly, map different database representations to common clinical concepts, and produce a reproducible standardized dataset.
That makes OpenICU particularly interesting for ICU research, cross-dataset analytics, clinical machine-learning workflows, and custom critical-care dashboards. The final dashboard, however, still needs a separate presentation and application layer.
For organizations evaluating the project today, the most accurate mental model is:
OpenICU = ICU data harmonization engine
MEDS = standardized medical event representation
Dashboard = separate visualization/application layer
That separation is precisely what makes the project useful — and also why calling OpenICU itself a complete critical-care dashboard would be misleading.

1 Comment
Pingback: Valheim Materials Calculator | Plan Crafting and Building Resources